
FM manager presenting cost variance report to finance colleagues in a glass-walled boardroom
The Meeting You Were Not Prepared For
The quarterly finance review is scheduled for 9 AM. Your FM operating budget is 11% over for the year to date. The CFO has the same number you do — pulled directly from the accounts payable system — and she wants to know which categories drove the overage, what caused each one, and what you are doing about it.
You have forty-eight hours to prepare. The problem is that your spend data lives in three places: the accounts payable system that finance controls, a spreadsheet your predecessor built four years ago that no longer matches the GL codes, and your own notes from contractor invoices that you have been approving one by one without a running total against budget. You know the building has been expensive this quarter. You do not know exactly why, line by line, and you cannot produce a clean variance explanation without rebuilding the picture from scratch.
This is the most common FM financial management failure — and it has nothing to do with whether the money was spent correctly. The spending may have been entirely justified. What is missing is the structured tracking system that would have told the story as the year unfolded, rather than requiring a forensic reconstruction the night before a board-level conversation.
Why FM Financial Tracking Falls Behind
FM operating budgets are complex. A mid-size commercial facility typically runs 8 to 12 cost categories — maintenance and repairs, utilities, cleaning, security, compliance, soft services, projects, and administrative overheads — each with multiple sub-categories and multiple vendors. The spend is continuous, reactive, and often unpredictable. Emergency repairs do not wait for budget cycles.
Most FM managers track spend in one of two ways: they rely entirely on the finance team’s monthly cost reports (which arrive two to three weeks after month-end and are rarely formatted for FM-level analysis), or they maintain an informal personal spreadsheet that tracks total spend but not variance against budget by line item.
Both approaches share the same fundamental problem: they tell you what was spent, but not whether it was within tolerance, what the trend looks like across the year, or where the risk of overspend is building before it becomes a crisis. By the time the quarterly finance meeting arrives, the FM manager is explaining the past rather than managing the future.
The second problem is commentary. Finance teams want more than numbers — they want a narrative. What caused the electricity overspend? Was the chiller repair a one-off or the beginning of an asset failure pattern? Is the cleaning contract underspend a genuine saving or a deferred service that will create a catch-up cost? FM managers who cannot answer these questions fluently lose the room, regardless of how competent their actual building management is.
What a Structured Cost Variance Tracker Does
A cost variance tracker is not a replacement for your finance system. It is a working document that runs in parallel — updated monthly by the FM team, formatted for FM-level decision-making, and structured to produce the narrative commentary that finance reports do not generate automatically.
A well-designed tracker does four things that informal spreadsheets do not.
It tracks variance, not just spend. The critical number is not what you spent — it is the gap between what you spent and what you budgeted to spend, expressed both in dollars and as a percentage. A $6,800 repair bill means nothing without knowing the monthly budget for that category was $5,000. The tracker makes variance visible at every line item, every month.
It uses a status flag system. Not every variance requires the same response. A 3% overspend on cleaning is noise. A 36% overspend on reactive maintenance is a signal. A well-designed tracker assigns a status to each line — ON TRACK (within ±5%), WATCH (between ±5% and ±15%), OVERSPEND (actual exceeds budget by more than 15%), or UNDER (actual is more than 15% below budget) — so that attention is directed where it is needed rather than distributed evenly across 40 line items.
It separates month-to-date from year-to-date. A single bad month is recoverable. A trend across four months is a structural problem. The tracker shows both views simultaneously, so a WATCH item in March that has been trending the same way since January is visible as a systemic issue, not just a monthly blip.
It produces the commentary your finance team needs. Every line item with a variance outside tolerance should carry a one-sentence explanation: the cause, whether it is one-off or ongoing, and the recommended action. This turns the tracker from a number-tracking document into a management communication tool. The CFO’s question — what caused this and what are you doing about it — is answered before she asks it.
What Changed When We Introduced Monthly Variance Tracking
I managed a commercial office portfolio in Singapore — six buildings, a combined FM operating budget of approximately SGD 4.2 million annually. When I took over the portfolio, financial reporting was entirely backward-looking: the finance team produced a monthly actuals report, the FM managers received it, and any variances were explained reactively when questioned.
We introduced a structured monthly cost variance tracker across all six buildings. Each building manager completed their tracker by the third working day of the following month — well before the finance team’s report arrived. When the finance report came in, the FM tracker was already complete, variances were already explained, and OVERSPEND items already had action plans assigned.
In the first full year, two things changed visibly. The quarterly finance reviews shifted from interrogation sessions to structured briefings — the FM team presented the variance picture before finance raised it. And the OVERSPEND rate across the portfolio dropped by approximately 30% over twelve months, because the monthly tracking discipline meant variances were identified and addressed in the month they occurred rather than after they had compounded for a quarter.
The tracker did not change what we spent. It changed when we knew about it and how quickly we acted.
| “In 20+ years of FM operations across Asia-Pacific and Europe, I have seen the same dynamic repeated at every level of building complexity. The FM team that controls its own financial narrative — that walks into the finance meeting with the variance story already prepared — is treated as a strategic partner. The one that waits for the finance report is treated as a cost centre to be managed.” |
What a Complete FM Cost Variance Tracker Covers
A tracker structured for FM operations should cover five sections, each building on the last.
- Monthly cost variance tracking table — all FM cost categories and sub-categories (Maintenance & Repairs, Utilities, Cleaning & Janitorial, Security, Compliance & Statutory, Soft Services, Projects & CAPEX, Admin & Overheads), with annual budget, monthly budget, actual spend, dollar and percentage variance, YTD columns, status flag, and commentary field. Pre-populated with sample data for a mid-size commercial office as a worked example.
- Status flag system — ON TRACK / WATCH / OVERSPEND / UNDER with defined thresholds (±5%, ±5–15%, >15% each direction) and required actions per flag. OVERSPEND triggers mandatory escalation within 48 hours. UNDER requires investigation before it is counted as a saving.
- Escalation log — a dedicated section for all OVERSPEND items, with named owner, root cause, action plan, and resolution timeline. This is the document your FM Director and Finance Controller sign off before the finance submission.
- 12-month rolling spend trend — a summary table showing actual expenditure by category across all 12 months of the financial year. This is the year-on-year trend reference that supports budget forecasting for the following year and makes seasonal patterns visible.
- Monthly sign-off and submission record — FM Manager, FM Director, and Finance Controller signature blocks with submission deadline (5th working day of the following month). This creates the audit trail that demonstrates the FM function is managing its financial obligations with governance discipline.
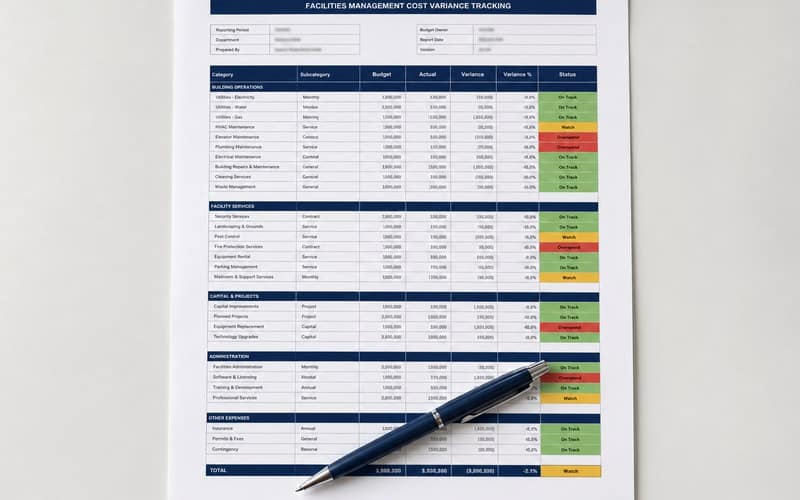
FM Cost Variance Tracker showing building operations, facility services, and capital projects categories with ON TRACK, WATCH, and OVERSPEND status flags
The tracker also includes an AI Prompt Toolkit — pre-written prompts for generating variance commentary, producing budget reforecasts, drafting overspend escalation memos, and writing month-end reporting summaries. The commentary prompt alone is worth the time investment: it eliminates the blank-page problem of writing 40 variance explanations at month-end.
The Tracker, Ready to Use
The FM Cost Variance Tracker is included in the BizzXpert FM Operations Playbook Pack Pro tier. It ships as a fully editable Word document with all five sections pre-structured, sample data populated for a mid-size commercial office, the status flag system built in, and the AI Prompt Toolkit included. An Excel companion version with automatic variance calculations and conditional formatting is available separately on bizzxpert.com.